The Charts below depict the Barometric pressure and Rainfall trend for the past 6-12 months
| Graphical
Trends
|
The Charts below depict the Barometric pressure and Rainfall trend for the past 6-12 months |
|
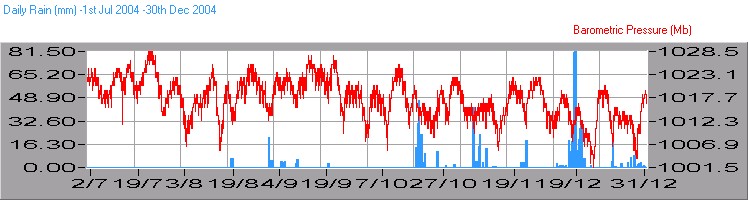
| The
chart below shows precipitation & barometric pressure for the
last 6 months of 2004.
|
||
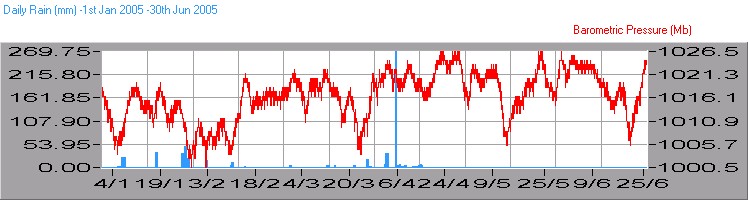
| The
chart below is for the period of 1st January 2005 to the current date. |
||
|
|
|
|
|
|
|
|